
I.II. Macro Cycles and The Changing World Order
Excitement around the AI productivity frontier within the tech bubble masks the reality of most macro indicators pointing to a gloomy time ahead - our multi-polar world is defined by social unrest, chronic regional conflicts, dysfunctional public institutions, global debt at all time highs, increasing stagflation indicators and a return to de-globalisation or isolationist policies.
Decades of offshoring manufacturing has crippled the Western industrial base, which largely relies on foreign, increasingly more unreliable or even hostile actors. Governments are mobilizing $tns, but incumbents lack the ability to not just rebuild, but modernise infrastructure within the time required.
In this chapter:Macro CyclesShift from a Uni-Polar to a Multi-Polar World OrderChina: A Masterclass in Building Real-World InfrastructureRussia: A War on Europe’s DoorstepImportance & Urgency Has Arrived in the West, but Execution Is Unclear
Macro Cycles
Nikolai Kondratieff, a Russian economist in the 1920s, observed that capitalist economies move in long waves of 40-60 years, now called Kondratieff cycles. Each wave begins with the diffusion of a transformative technology, such as steam engines, railways, electricity, automobiles, or ICT, that drives decades of growth, investment, and rising prosperity. As the technology matures, overcapacity, debt build-up, and inequality set in, leading to stagnation, financial crises, and often social or geopolitical upheaval, which is referred to as the “winter” phase of the cycle. These waves matter because they highlight that economic history isn’t just a series of short business cycles, but is structured by deep technological and energy paradigms that shape productivity, institutions, and geopolitics.
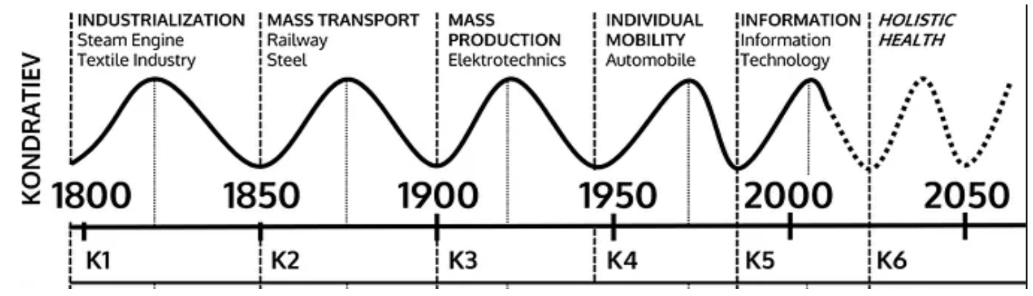
Looking at the current macro indicators, most of them point towards a Kondratieff Autumn or Winter (=the trough/decline) - although some argue we are in the “spring” phase with the advent of AI being a new catalyst for growth. The big picture is mixed to say the least - objectively, while not all indicators may be on “red”, most of them are at least on “amber”, or turning “red”:
Social unrest, dysfunctional public institutions / governments
Political polarisation in the US has risen to the highest level since the American Civil War - driving political interests into opposing poles on the political spectrum, which is increasingly rendering consensus-driven political systems dysfunctional (e.g. Germany’s recent “traffic light coalition” of social democrats, greens, and liberals collapsed because the three parties had fundamentally different priorities - Germany’s consensus-driven system makes it hard to override such divides, resulting in gridlocks, ideological vetoes and indecisiveness where nothing gets done).
Public trust in governments is near all-time lows. The % of Americans who say they trust the government to do what is right just about always/most of the time dropped from 77% in the 1960s to 22% in 2024. Fear that “leaders lie to us or purposefully mislead people” is at all-time highs.
Government effectiveness index dropped from ca. 1.8 to 1.2 across the US, Germany, and UK in the past two decades - it measures how well a government delivers public services, formulates and implements sound policies, and maintains credible institutions.Collapse of old growth engines
Western economies have grown reliant on services and finance, hollowing out production. Their old engines - such as Germany’s automotive sector and U.S. semiconductor fabrication (37% of global production in 1990, now only 12%) - face existential challenges from energy costs, Asian scale advantages, and technological disruption, eroding the foundations of Western industrial strength.Structural decline in growth of productivity
Total factor productivity (TFP) growth in advanced economies fell from ca. 1.3% per year (1995-2000) to just 0.2% in 2023, “accounting for half of the GDP growth reduction” in recent years. TFP measures how efficiently an economy turns inputs like labor and capital into output. Unlike simply adding more workers or machines, TFP captures improvements in how those inputs are used through better technology, processes, skills, and organization. Rising productivity is the main driver of long-term growth, competitiveness, and higher living standards.High debt levels
Global debt is at all-time-high at a record 325% of global GDP. Governments face higher debt servicing costs. High debt levels amplify the risk of crises. Governments and central banks have less room to stimulate in the next downturn. On the other hand, advanced economies still benefit from deep capital markets and policy tools to manage debt. The outcome ultimately depends on growth and productivity - both currently hanging in the balance. Without them, debt becomes a drag. With them, today’s levels may remain sustainable.Global conflicts
Russia vs. Ukraine, now entering its fourth year, grinding into a costly war of attrition with huge geopolitical stakes for Europe and NATO. The Israel vs. Hamas/Gaza conflict causes heavy civilian tolls and risk of escalation involving Hezbollah, Iran, and US forces, which could destabilize the wider Middle East. Red Sea tensions, where Houthi attacks on shipping are disrupting global trade and drawing Western military responses. The ongoing US vs. China rivalry over Taiwan and the South China Sea, a flashpoint for potential great-power confrontation, with military build-ups, frequent near-misses, and major economic stakes tied to global trade and semiconductors. Emergence and escalation of regional conflicts has become chronic.Persistent stagflation
The Western world isn’t experiencing full-blown stagflation - a dangerous combination of high inflation, combined with little or no economic growth - but risks are higher than in recent decades. After post-pandemic inflation peaks, price pressures are easing, while growth in the US, UK and euro area has slowed to ca. 1-1.9% and unemployment remains modest. The mix is often described as “stagflation-lite”: sluggish expansion with inflation still above central-bank targets. The trend is toward lower headline inflation but weaker growth, leaving a moderate risk of stagflation if shocks or policy missteps occur.Asset bubbles
Across major asset classes, several bubbles or near-bubbles shape the macro backdrop. Mega-cap tech and AI leaders now account for 34-37% of S&P 500 market value, with many trading at forward P/Es above 25-30x. The top 5 largest companies make up >25% of the index by market cap. Bitcoin jumped from under $5k in 2020 to over $68k in 2021, plunged to $16k in 2022, and trades above $100k in 2025, while NFT volumes collapsed after a $25bn peak. Private-credit assets have swelled to about $2tn, a more than 10 times increase since 2009. U.S. office real-estate values are 20-30% below 2019 highs, with more than $1.5tn of CRE debt maturing by 2026. Venture funding hit $650bn in 2021, and late-stage valuations have seen 40-60% markdowns since 2022.Deglobalisation
Hyper-globalisation of recent decades has made way to a more fragmented, bloc-tilted system, with protectionism and efforts to rebuild local production, manufacturing, and energy capacity set to persist. US/China tariffs now average 30-50% (vs. ca. 3% pre-2018), global foreign direct investment (net inflows) has fallen from 3.6% of GDP in 2015 to 1.3% in 2024, and major subsidies drive sovereign production and supply networks. Export controls on chips, rare earths, and carbon-border tools tighten state direction. World trade volumes remain relatively high (WTO goods barometer at 103.5, temporarily propped up by anticipation of higher tariffs) and regional pacts cushion flows, but the 5- to 10-year outlook points to slower, politicised trade, higher supply-chain costs, and persistent industrial policy with a growing focus on sovereign infrastructure such as grids, ports, rail, factories, and data centres.
Shift from a Uni-Polar to a Multi-Polar World Order
The post-Cold War system built around a single dominant power - the United States - has begun to fragment. Global economic, security, and institutional leadership is no longer concentrated in one center. Instead, a multi-polar structure has emerged, defined by several regional and functional power hubs, each exercising meaningful influence within its sphere.
Several structural changes underpin this transition:
Global manufacturing has consolidated around Asia: China now accounts for roughly 30% of global manufacturing value-add, more than the US, Japan, Germany, and India combined.
Defense spending has increased significantly: Reaching $2.7tn in 2024, a 9.4% increase over the previous year and the fastest rise since the Cold War.
Trade has become more politicized: Export controls, industrial subsidies, and regional supply-chain strategies have replaced the liberal, rules-based consensus that once defined globalization.
The move from a uni-polar to a multi-polar world is structural and enduring. Economic power and defence capability is becoming more evenly distributed, while the ability to manufacture, secure energy, and protect trade routes once again defines nations’ relative standing. The emerging order is defined less by ideology and more by practical capability to deliver, defend, and adapt at scale.
China: A Masterclass in Building Real-World Infrastructure
Over the past decade, China has consolidated its role as “the world’s factory”, starting with basic consumer goods and increasingly moving into more advanced manufacturing and capable end-products.
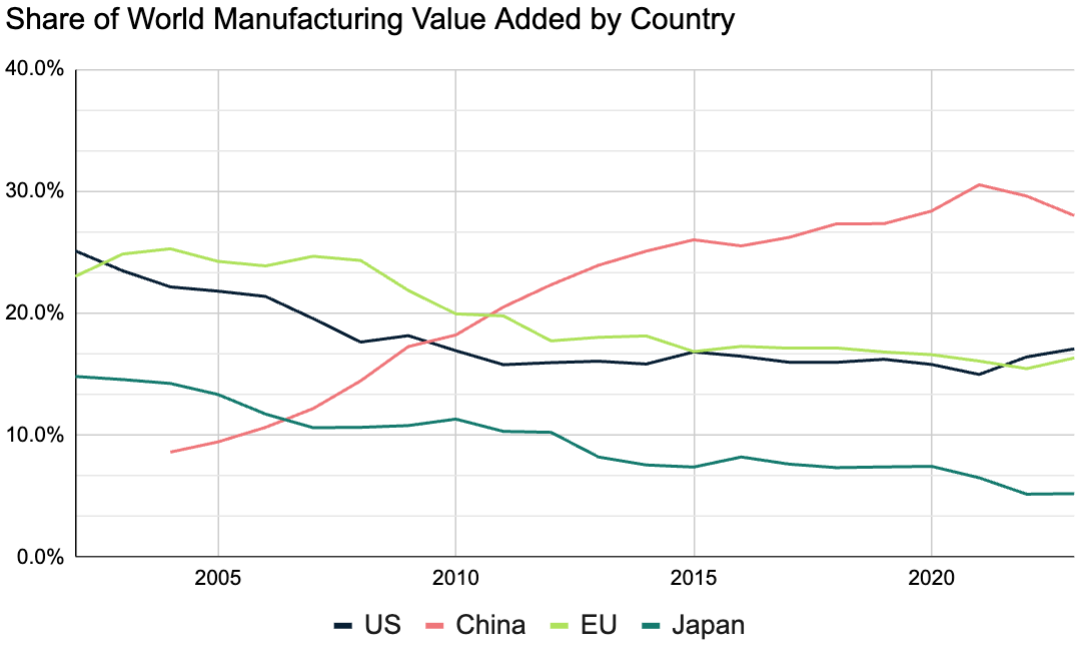
China’s share of global manufacturing value added increased from 6% in 2000 to a staggering ca. 30% in 2025, while both Europe and the US declined from 25-27% to 15-17%.
Manufacturing value added is the amount of new economic value created when raw materials or components are transformed into finished goods. For example, when a factory turns steel and chips into a car. It measures only the extra worth added inside the production process.
Manufacturing value added = Value of finished output - value of purchased intermediate goods and services
It avoids double counting and shows how well a nation turns resources and know-how into valuable products.
China’s rise from about 6 % of global manufacturing value added in 2000 to ca. 30% by 2025 was powered by both scale and sophistication: rapid investment and urbanisation vastly expanded output, while policy support and R&D spending (now 2.6 % of GDP, up from <1 % in 2000) enabled a shift from low-margin assembly into higher-value industries such as electronics, machinery, EVs and batteries, allowing China to secure almost one-third of world manufacturing.
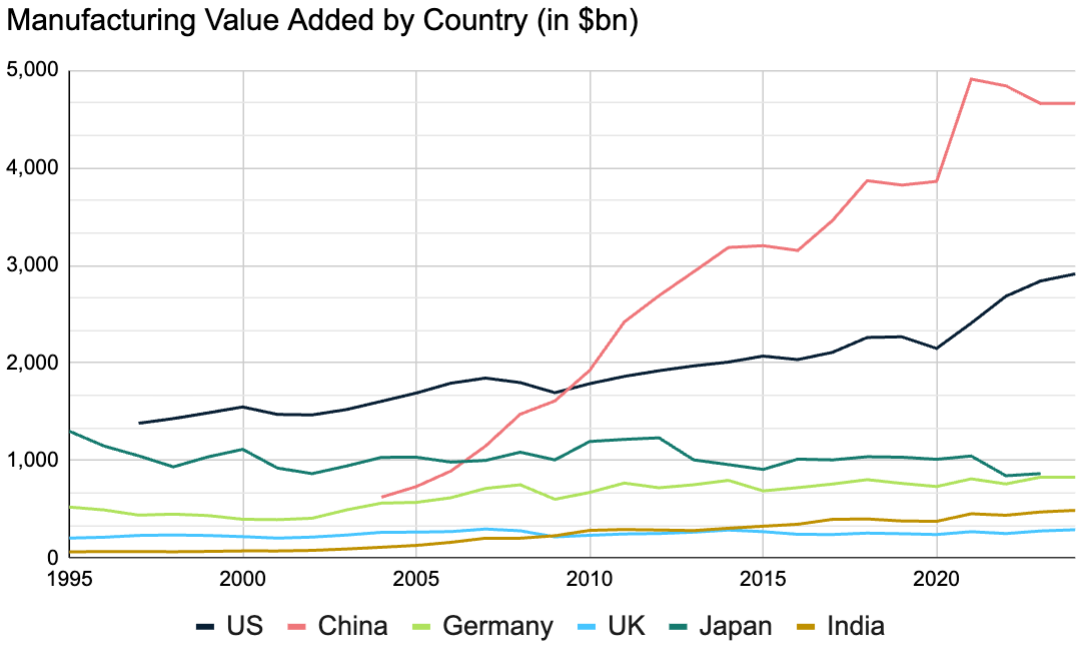
Source: World Bank
China has also demonstrated a masterclass in physical infrastructure build-out:
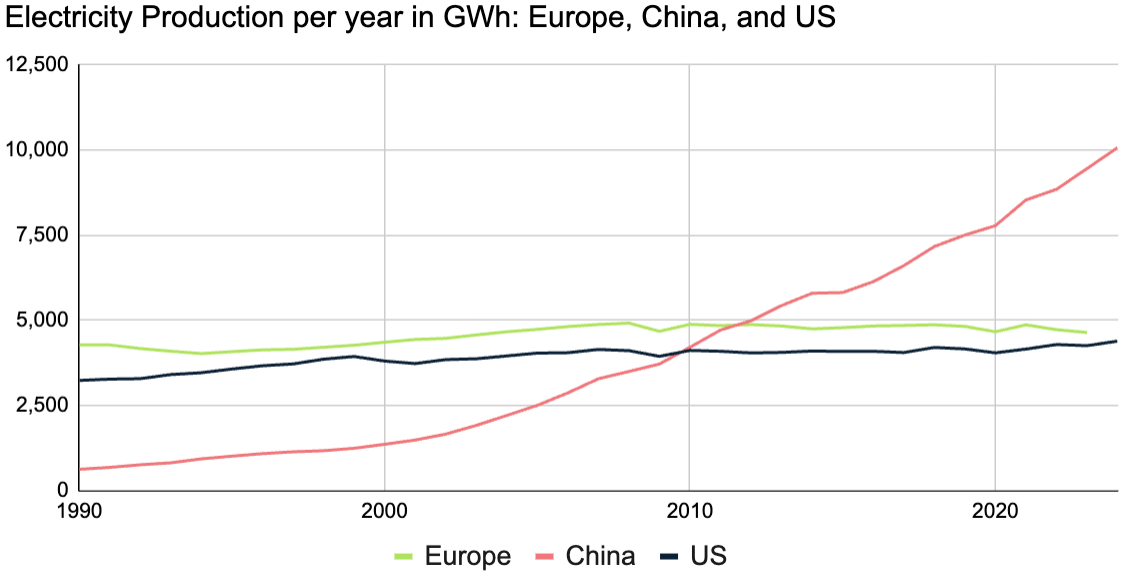
Energy Generation: China’s electricity-generation jumped from 1,356 TWh in 2000 to 10,073 TWh in 2024, making it the world’s largest producer of electricity. It now hosts >50 % of global wind and solar capacity, and is adding more solar power each year than the rest of the world combined.
Logistics & Transport: China’s high-speed rail (HSR) network grew from zero in 2008, to ca. 48,000 km, more than ⅔ of global total, linking virtually every major city. The National Trunk Highway System grew from 11,605 km in 2000 to 190,700 km in 2024. The US Interstate Highway System measures 78,465 km in 2023 (vs. 75,100 km in 2000). Seven of the world’s ten busiest container ports are in China.
Commercial Shipbuilding: One Chinese state owned shipbuilder (CSSC) built more commercial vessels by tonnage last year, than the entire US shipbuilding industry since WW2. Chinese yards now deliver ca. 50 % of global new ship tonnage (with 57% share of ships currently under construction), dominating tankers, bulk carriers, and increasingly high-tech LNG carriers.
Military Shipbuilding: There’s already a significant difference in fleet size, with China maintaining over 370 vessels vs the US’ 296 vessels, but the real concern should be that ca. 25% of the US fleet was launched after 2010, while China launched 70% of its fleet after 2010. A leaked US Navy intelligence slide, verified by the Office of Naval Intelligence, estimated that China’s shipbuilding capacity exceeds that of the United States by a factor of ~230 to 232 times (caveat: this capacity includes both commercial and military yards, with many shipyards operating in a “dual-use” mode).
Source: Our World in Data
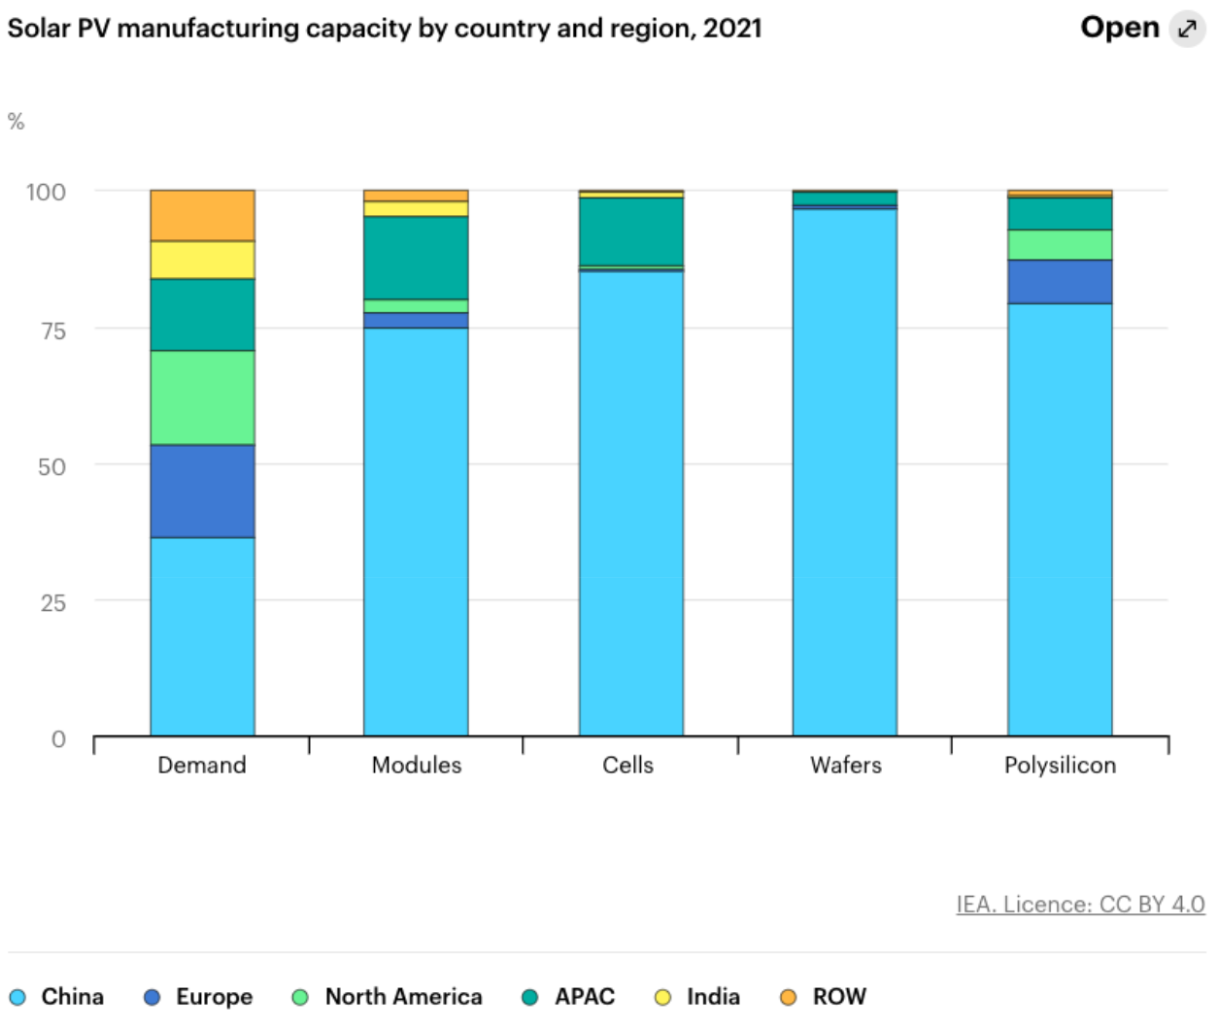
Source: IEA
The EV market is another relevant anecdote: The German carmakers used to be the pinnacle of automotive engineering, but have struggled to execute on the electrification wave, while Tesla emerged as a leader in the US market. German carmakers and Tesla heavily relied on China’s vast consumer market as a key profit center, generating up to 30% of their revenue in China.
The EV sector is also the clearest example of China’s catfish strategy. When Tesla entered China, it was granted unusually generous terms - full ownership of its Shanghai factory, preferential financing, fast-track permits. Many in the West saw it as a sign of openness, but it may have been a calculated move: lure Tesla in, supply it, learn from it, then copy and outperform it - absorbing its manufacturing techniques, supplier coordination methods, and factory automation playbooks.
Now the tables have turned: Chinese EV producers, such as BYD are building more capable and at the same time, more cost-effective vehicles, rapidly dominating their home market and pushing aggressively into Western markets.
Ironically, much of Tesla’s own manufacturing and supply-chain sourcing was outsourced to Chinese plants and suppliers, helping modernise and scale China’s manufacturing infrastructure - a foundation Chinese firms later leveraged to compete.

Source: Own Illustration, Midjourney
Core structural drivers of China’s industrial strength - beyond historically lower labor costs and availability of raw materials:
Large home market: China’s vast domestic demand creates natural scale advantages and rapid feedback loops. Sectors like EVs, batteries, and solar equipment are driven by hundreds of millions of consumers and massive infrastructure programs - 59% of global EV demand came from China in 2023.
State-directed, long-horizon demand stability: Industrial policy such as “Made in China 2025”, long-term procurement targets, and state-backed buyers create predictable order books and stable utilization for factories. This reduces demand volatility and enables multi-year capex planning - something rare in Western markets driven by quarterly earnings and fragmented public procurement. The government’s top-down coordination and prioritisation also accelerates standardization across entire sectors.
Lower cost of capital: Chinese manufacturers benefit from a credit environment that systematically underprices industrial risk. Policy banks and local funds provide loans or guarantees at rates 150-400 bps below Western equivalents, often tied to strategic sectors like semiconductors or green energy. Recent PBoC data show weighted-average new-loan rates around 3.3-3.7%, compared with roughly 4.0-4.6% for euro-area corporates and 6.5-8% for US small businesses. This structural cost advantage lengthens planning horizons, lowers hurdle rates, and enables firms to invest heavily in automation, capacity, and R&D.
Industrial clusters & infrastructure: Dense regional ecosystems - especially around Shenzhen, Suzhou, and Chongqing - integrate suppliers, tooling, logistics, and skilled labor within tight geographic proximity. This concentration enables rapid iteration, faster prototyping, and shared infrastructure that dramatically compresses costs and timelines. These clusters act as self-reinforcing innovation loops, continuously recycling expertise, talent, and capital across generations of firms.
Technological absorption and scaled industrialization: China’s industrial rise over the past decade has been less about radical invention and more about scale learning - absorbing global technologies and improving them through relentless iteration and vertical integration. The EV and battery sectors, for example, built on imported IP but advanced faster through scale-driven learning-by-doing.
That being said, China has their own challenges in aging demographics, local-government debt overhang, and capital outflows. The rapid rise of China is also in large part a product of an autocratic society with government-led, long-term planning - and concerning side effects in censorship, oppression, and corruption.
Lastly, the China-Taiwan conflict is one of the most dangerous flashpoints in geopolitics. After the Chinese Civil War ended in 1949, the defeated Nationalist government fled to Taiwan, which has since developed into a democratic, technologically advanced state. Beijing still views the island as a breakaway province that must be reunified, by force if necessary. Taiwan’s central role in global semiconductor manufacturing - especially through TSMC - makes it both a strategic and economic chokepoint. According to the Atlantic Council’s Global Foresight 2025 survey, nearly 65% of experts now believe China will attempt to retake Taiwan by force within the next decade, up sharply from 50% in 2024. This reflects China’s accelerating military buildup, hardening rhetoric, and push for industrial self-sufficiency in chips, energy, and defense. The growing risk of conflict is already reshaping global supply chains, driving re-industrialization and defense investment across the West. If the United States were drawn directly into a confrontation to defend Taiwan, the consequences for global stability, trade, and technological progress could be very severe.
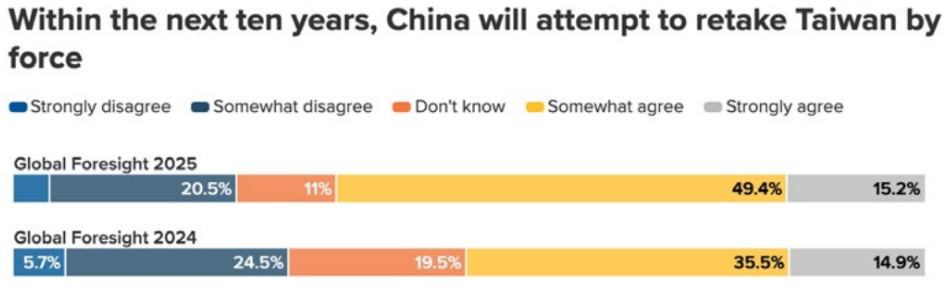
Source: Atlantic Council
Bottom line: China’s meteoric rise has transformed it into the world’s dominant manufacturing power - built on scale, state coordination, cheap capital, and dense industrial clusters. This ascent serves its broader strategic goals: achieving technological self-reliance, ensuring prosperity through global indispensability, and ultimately completing national unification with Taiwan. Yet underneath the strength are growing risks: an aging population, rising debt, and mounting geopolitical tension. As Beijing pushes for industrial and geopolitical advantage, the West is racing to reindustrialize and secure critical supply chains. The resulting collision of ambitions sets the stage for a defining test and potential reshuffling of the modern global order, with Taiwan as its most dangerous flashpoint.
Russia: A War on Europe’s Doorstep
Russia’s full-scale invasion of Ukraine in 2022 marked the return of industrial-scale warfare to Europe. What many Western analysts first assumed would be a short-lived failure has instead turned into a long, multi-year war of attrition and one where Russia has proven unexpectedly adaptive. Its economy has effectively shifted to a wartime production: defence spending now exceeds 7% of GDP, ammunition production has tripled, and UralVagonZavod has tripled the production of its most advanced operational tank, the T-90M. Western sanctions have hindered advanced weapons production, but have not stopped Russia’s ability to mass-produce cheap artillery, drones, and armor with help from China, Iran, and North Korea.
Beyond Ukraine, Russia has escalated grey-zone pressure on NATO’s flank. In September 2025, Russian drones violated Polish airspace, prompting Article 4 consultations, and three MiG-31s breached Estonian airspace days later. Lithuania reported a fresh incursion in late October. Finland likewise summoned Russia over suspected violations. Cyberattacks and sabotage attempts across European energy and logistics infrastructure have surged, suggesting a deliberate campaign to probe and normalize hybrid operations, incl. widespread GPS jamming disrupting civil aviation across the Baltic-Nordic region.
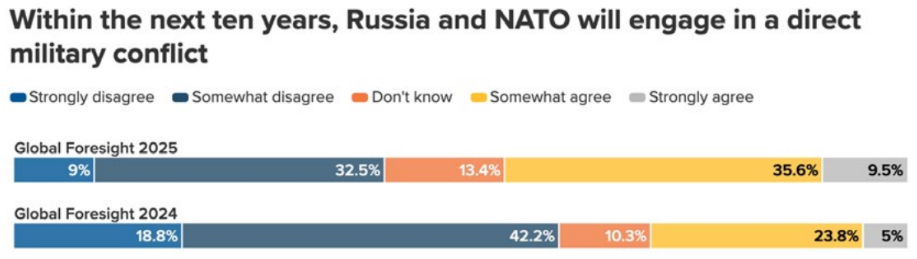
Source: Atlantic Council
Russia's armed forces are about the same size as all of Europe’s in aggregate, but they are more concentrated, mobilized, and unified under a single country’s command. Europe’s top ten armies together count roughly 1.2-1.4 million active troops, comparable to Russia’s estimated 1.1-1.5 million, not counting reservists, but Europe’s forces are spread across 27 governments, incompatible doctrines, and slow decision cycles, while Russia can deploy mass quickly under a single command.
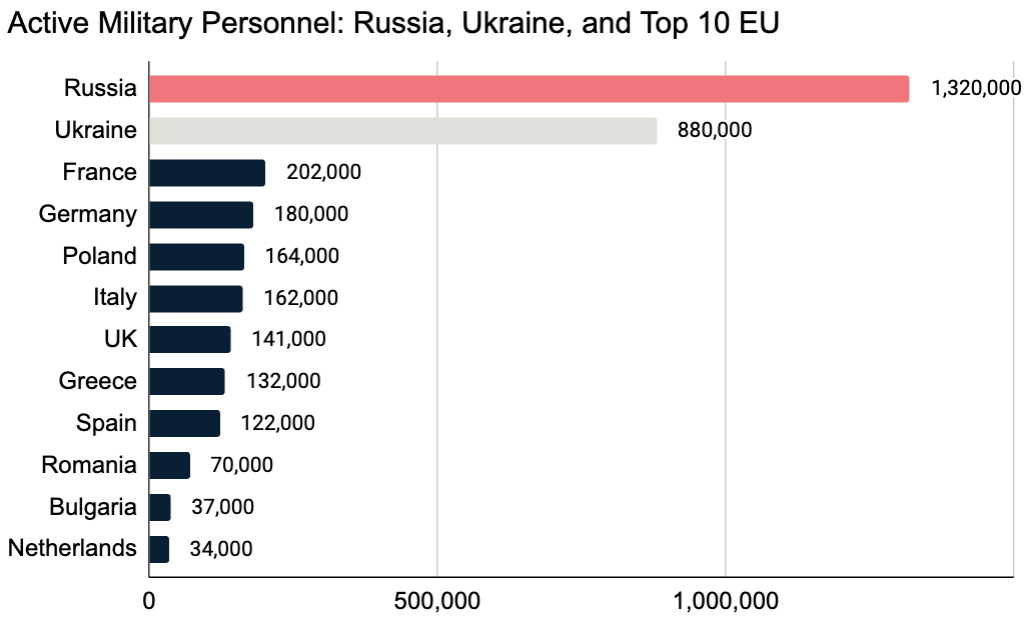
Source: Wikipedia
Troop numbers set the scale of potential mobilization, but they are only one variable in Europe’s balance against Russia. In a direct confrontation, Europe and NATO would hold overwhelming advantages in high-tech capabilities, such as precision strikes, airpower, surveillance, electronic warfare, and missile defence, as well as US nuclear and logistical backing. However, Russia retains advantages in speed of mobilization, internal command unity, and industrial-scale munitions output - areas where Europe is slow, fragmented, and underprepared.
Bottom Line: Most serious defence analysts now expect not a global cataclysm, but chronic regional escalation. Russia is building for long-term industrial war and might test NATO within 2-3 years if momentum in Ukraine shifts in its favour. Russia most likely lacks the economic or demographic depth to aggressively expand into Europe - but even further escalation in the Baltics or Poland could be devastating. China could do serious damage on the world stage in a large-scale conflict and is a serious economic adversary in the long-run, but expansionist ambitions beyond Taiwan also seem unlikely.
Importance & Urgency Has Arrived in the West, but Execution Is Unclear
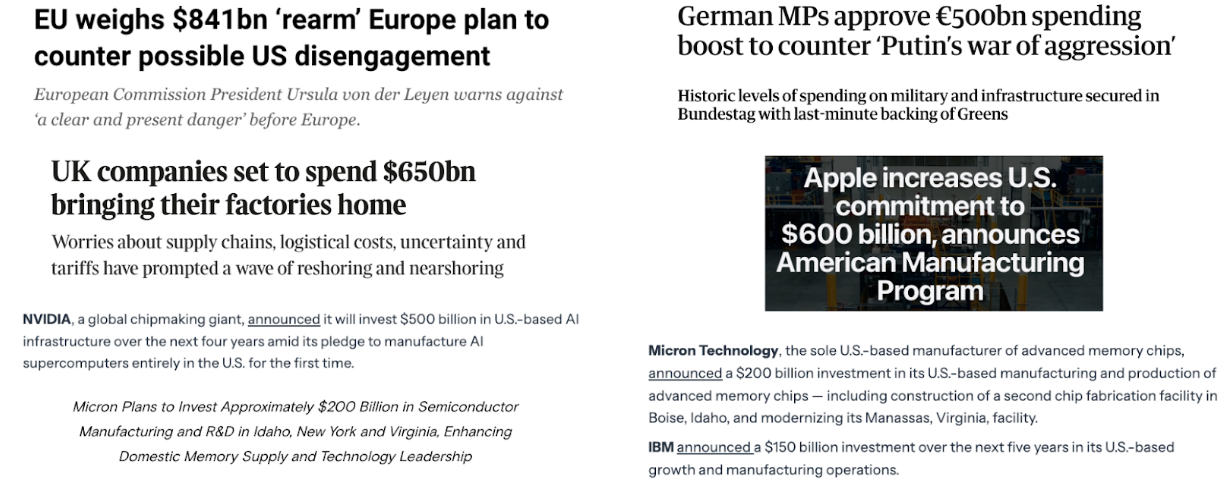
Across the US and Europe, governments & companies are pouring $tns into “bringing their factories home”. The EU’s proposed “Rearm Europe” plan ($841bn) and Germany’s €500bn special fund aim to lift defence spending well above 2 % of GDP, modernise grids, rail and broadband, and expand arms production. In the US, companies are reshoring at unprecedented scale: Apple’s $600bn American Manufacturing Program, TSMC’s $100bn Arizona chip fabs, and Micron/IBM investments of $200bn and $150bn target semiconductors, AI hardware and advanced assembly.
Together, these moves mark a shift from decades of offshoring toward large-scale, security-driven industrial renewal, though execution remains the main risk to translating record budgets into real capacity.
Reshoring and record defence-industrial budgets are only a starting point. Companies we think of as manufacturing companies - BAE Systems, Apple, BMW, Siemens, etc. - first and foremost design and assemble end-products, but sit atop hundreds or thousands of component and process suppliers, from castings and PCBs to rare-earth magnets, precision tools, logistics, and testing. For decades, much of this ecosystem migrated to Asia, where suppliers clustered around anchor factories, benefiting from scale, shared know-how, and steady demand. Bringing final assembly back to the US or Europe without simultaneously restoring that supplier base risks creating expensive islands of production that still import most of their value. This wouldn’t achieve the underlying goal of building a more resilient, sovereign industrial base. It’s like bringing home the head without the body.
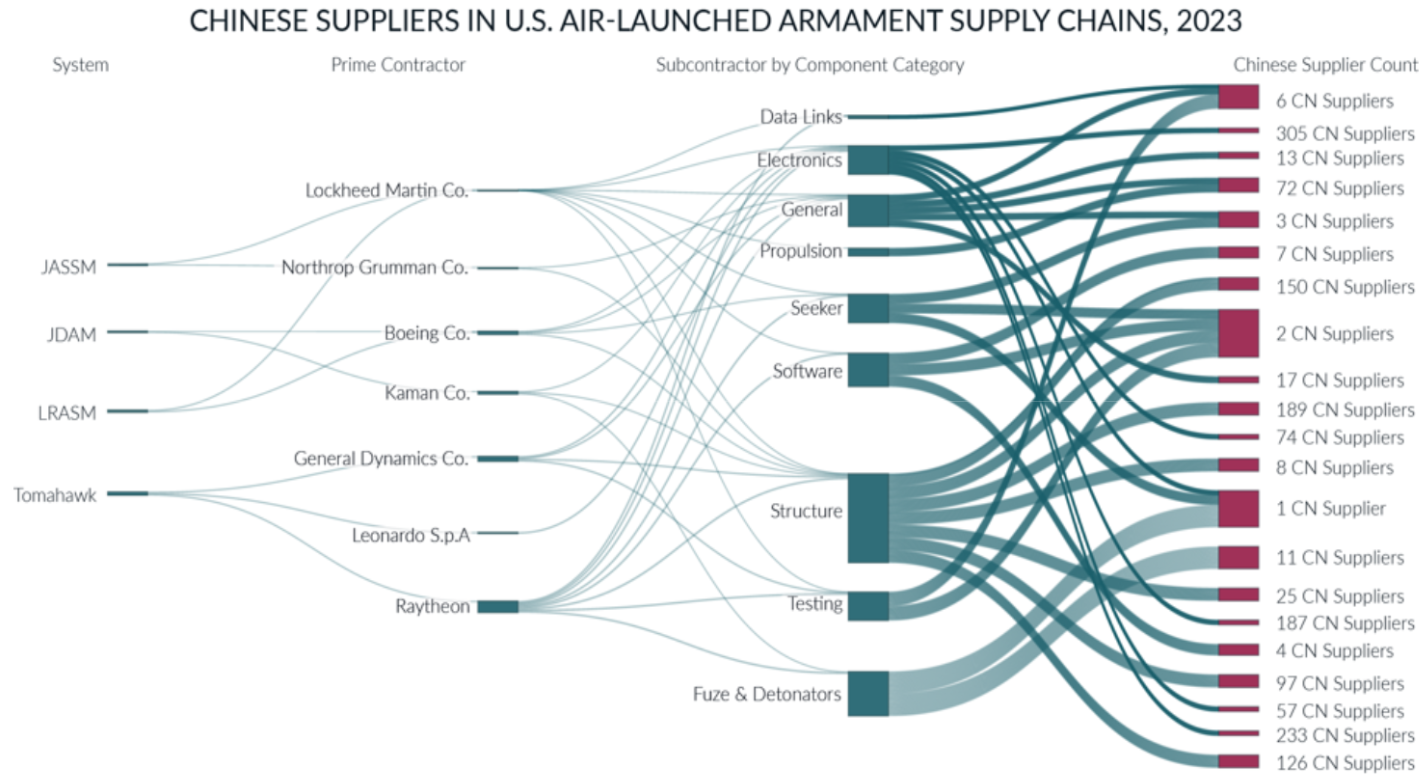
Source: Govini, Forbes
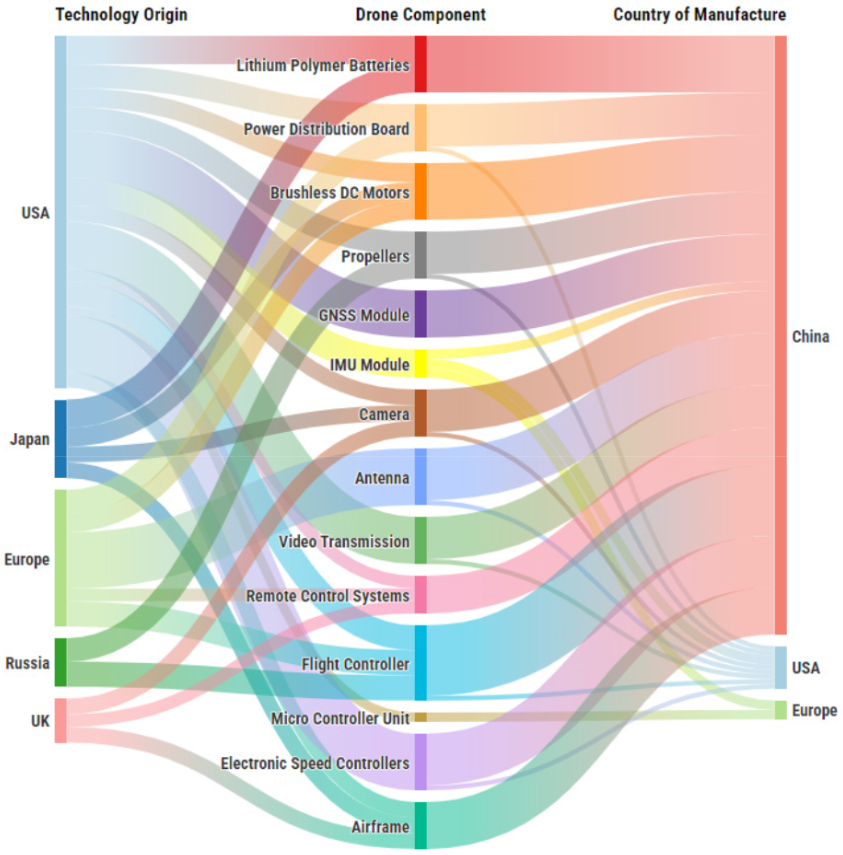
Source: Edlyn Levine & Fiona Murray, MIT
The graphic above on drone components clearly shows that most of them were invented in the US, Europe, or Japan, but almost all are now manufactured in China.
Delivering on these recent record industrial and defence pledges hinges on solving four execution gaps/challenges:
Industrial Ecosystem & Supplier Density: Decades of offshoring hollowed out the “missing middle” of US and European manufacturing. The tier-1/2/3 suppliers that make castings, tooling, precision machining, PCB and chip packaging, rare-earth magnets, and specialty chemicals. Much of this capability now resides inside tightly knit Asian clusters where suppliers, testers, logistics and labour co-locate around anchor plants. Without targeted investment to rebuild upstream capacity and encourage supplier co-location, new fabs, gigafactories or shipyards will capture only final assembly while 60-80 % of value remains imported, undermining the strategic intent of reshoring.
Stability & Cost of Capital: Announced public budgets and private capex as listed in the 100s of $bns above are necessary but not sufficient. Suppliers will only build new plants if they can finance them cheaply and see stable, multi-year orders. Chinese manufacturers enjoy vast domestic markets, state-backed procurement, and long-horizon policies that create thick, predictable order books. Chinese firms receive loans or guarantees at rates often 150-400 bps below those available to Western mid-tier suppliers. Converting headline sums into capacity therefore requires Western governments and primes to replicate what Asia provides implicitly: patient demand commitments and affordable financing for the entire supply chain.
Time & Complexity of Scale-Up: Even with funding secured, large industrial assets have long gestation periods: key equipment such as lithography machines, production tools, dry docks, or cryogenic systems can take 12-36 months to deliver, and complex facilities, such as fabs, battery gigafactories, or naval yards typically need 3-5 years from groundbreaking to stable output. Permitting and environmental reviews stretch this further: in the US or EU, approvals for major plants can add 12-24 months or more, whereas in China local authorities often fast-track strategic projects in 3-9 months. Qualification, supplier certification, and early yield ramp add additional time. Public expectations are often misaligned with the physical and regulatory speed at which ships, fabs, or gigafactories can be built and ramped.
Workforce & Tacit Knowledge: Labour is arguably the hardest constraint. The US and Europe face shortages of machinists, fab technicians, process engineers, industrial electricians, and naval fitters numbering in the hundreds of thousands. Training cycles for these roles take 2-4 years or more, and many shop-floor skills are tacit, i.e. embedded in routines and informal know-how that eroded when production offshored. Ageing and now retiring workforces compound the gap. Without scaled apprenticeships, technical colleges, targeted immigration, structured knowledge transfer from existing experts, and tech innovation to scale existing talent, large sums risk idling.
Capturing the entire value chain down to raw materials and refinery is impossible, but the West needs to integrate the sovereign supply chain as deep as possible (and economically feasible). Only bringing assembly sites back to the West is a good start, but it alone doesn’t fix the structural issue.
Europe’s approach to foreign acquisitions of strategic industrial assets also warrants greater scrutiny. In recent years, key advanced-manufacturing firms such as Germany’s KUKA (acquired by China’s Midea in 2016) and ABB’s robotics division (sold to Japan’s SoftBank) have come under foreign ownership.
True resilience will require parallel investment in upstream capacity, vocational training, and streamlined siting so that new fabs, yards and gigafactories anchor complete domestic or allied supply chains, not just final assembly.
Next chapter: Laying out the method to translate technology + capital + labor into real industrial impact - rapidly and at scale.